
Zcash PAI Analysis - 10th October, 2026
Zcash PAI (Power Amplitude Index) & Probability Outlook
The Power Amplitude Index (PAI) measures where Zcash’s price sits relative to its own historical behavior. Instead of asking, “Is price going up or down?” PAI answers a more useful question:
Is Zcash currently expensive or cheap relative to its history?
This matters because price tends to behave differently in different regions:
| PAI Range | Interpretation | Typical Market Behavior |
|---|---|---|
| 0.0 – 0.2 | Historically Cheap | Accumulation, favorable entry conditions |
| 0.4 – 0.6 | Mid-Range | Chop, ranging behavior, little directional edge |
| 0.8 – 1.0 | Historically Expensive | Distribution, profit-taking, mean reversion risk |
PAI is calculated using no look-ahead bias — meaning the model never uses future price data. This preserves causality, prevents hindsight distortion, and makes the signal reliable in forward use.
Current Zcash Positioning (Latest PAI Composite Chart)
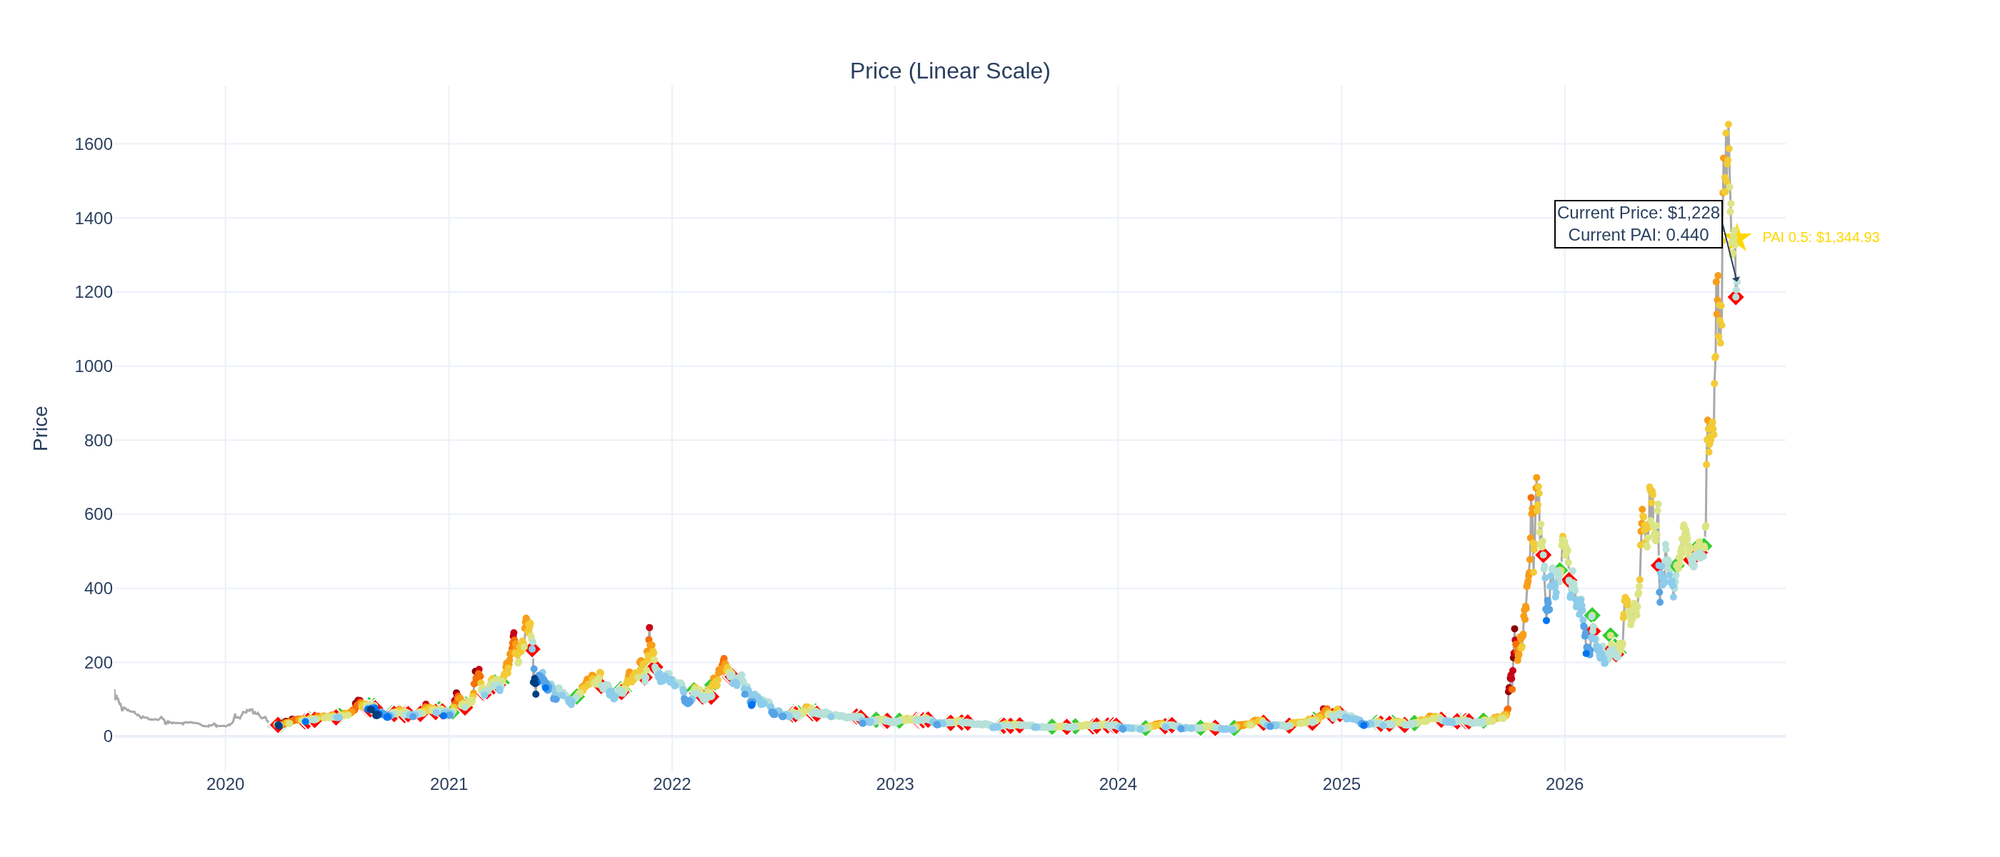
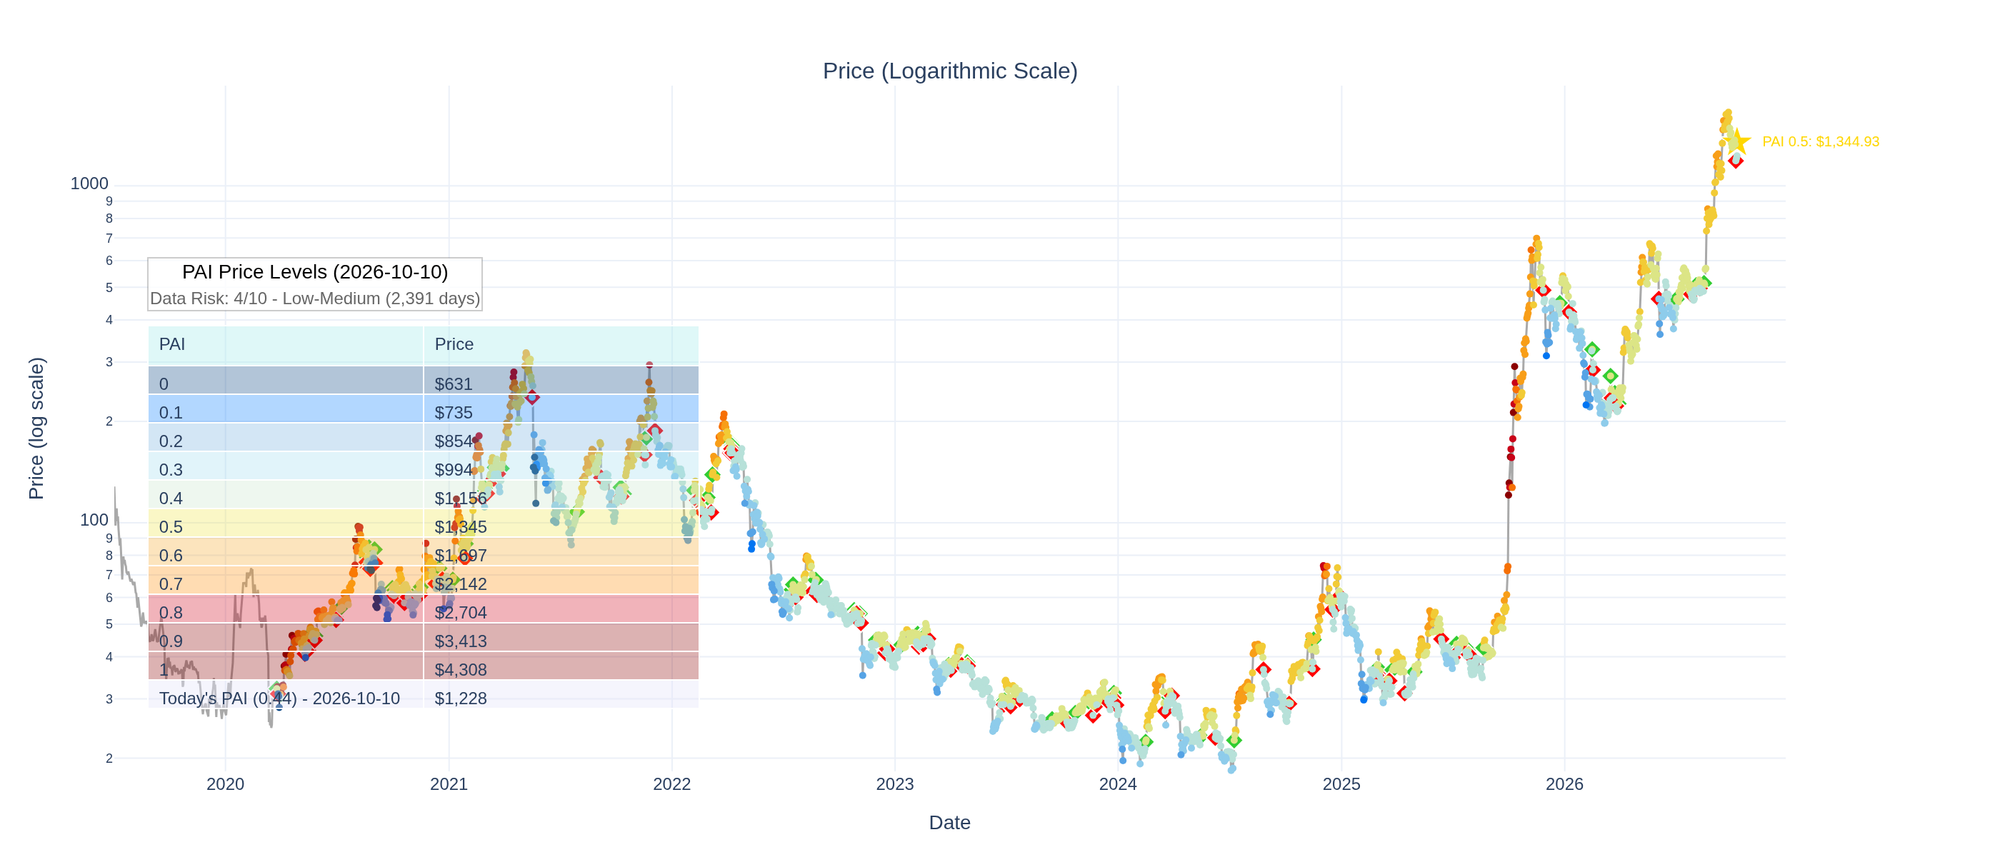
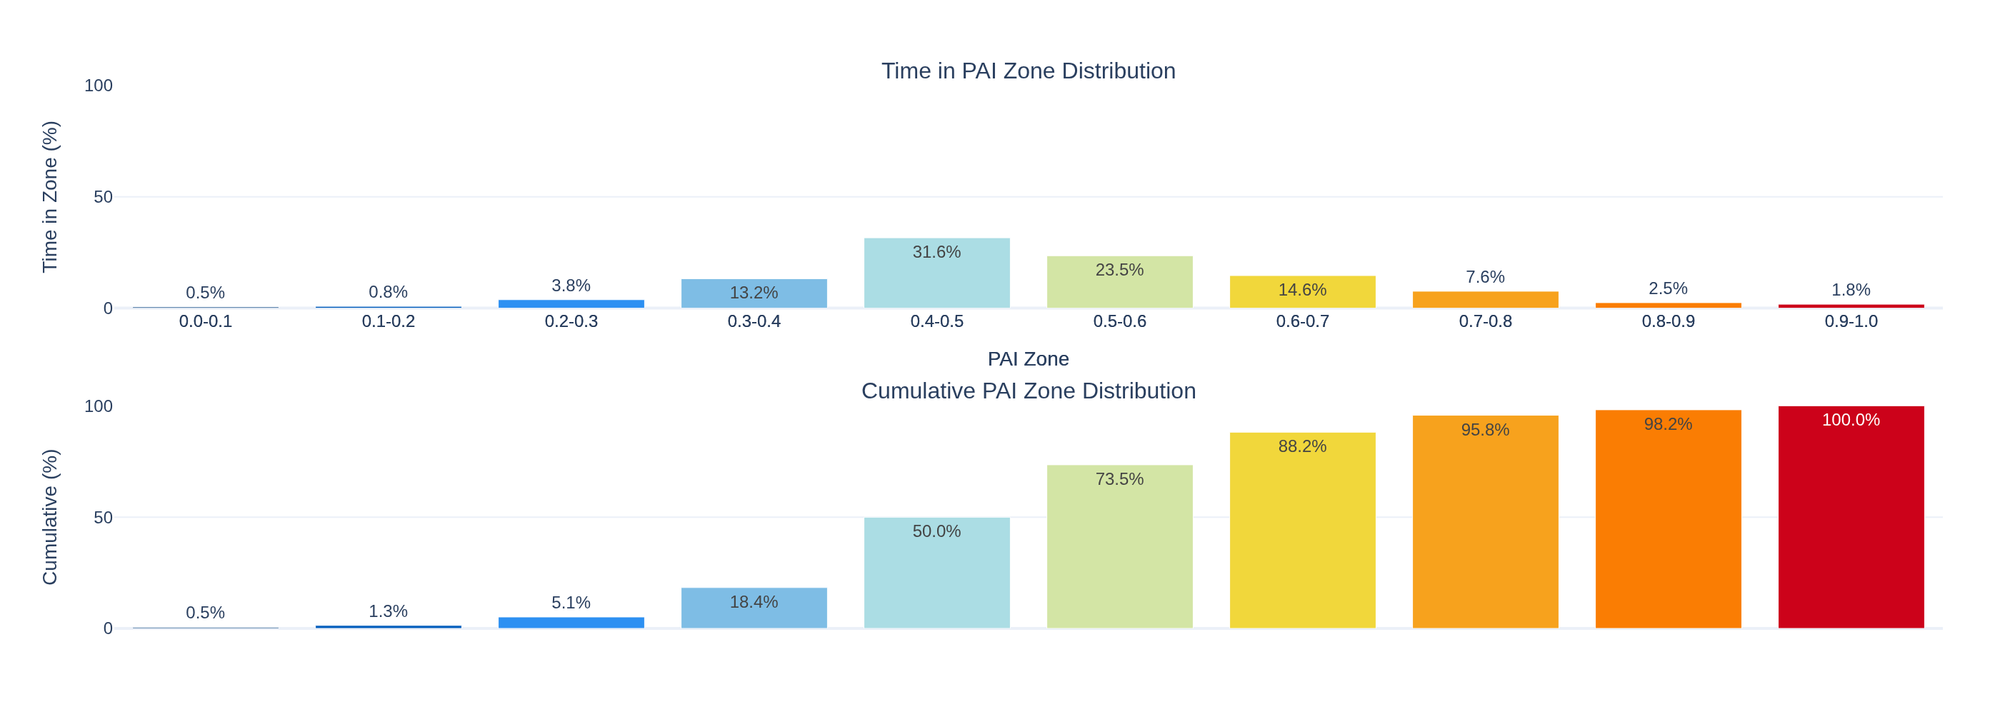
How to Read the Chart Above
These charts show three layers of analytical insight:
-
Price Colored by PAI
Shows whether current price is in a historically cheap (blue) or expensive (red/orange) region. -
Time Spent in Each PAI Zone
Reveals where ZEC tends to live historically.
The distribution shows which PAI zones occur most frequently in the available history; it does not guarantee future outcomes. -
Cumulative Zone Distribution
Shows how far into historical structure each zone extends — how deeply price tends to reach.
Taken together, the chart acts as a market weather report:
It does not predict the future — it tells us where conditions favor patience vs aggression.
Practical Positioning Framework
| Market Condition | Expected Behavior | Best Action |
|---|---|---|
| PAI 0.0–0.2 | Structural value & accumulation regime | Scale in gradually with limit orders |
| PAI 0.3–0.6 | Drift, chop, no structural edge | Do nothing / hold positioning |
| PAI 0.7–1.0 | Distribution pressure, mean reversion | Scale out / risk manage |
This framework is designed to remove emotion from execution and replace it with statistical advantage.
How This Fits Into the Larger Framework
PAI shows where we are in the cycle locally, but does not show where we are globally.
To understand broader macro-cycle positioning, we combine PAI with the Bitcoin Power Law Model:
| Model | Purpose |
|---|---|
| Power Law | Defines long-term structural trajectory / cycle context |
| PAI | Defines short-term value zones and execution timing |
Together, they create a complete directional + execution system.
Read the full integrated explanation here:
https://powerlawinvestor.com/pai-guide/