
PAI (Power Amplitude Index) Guide
TL;DR: The Full Framework in 60 Seconds
- The Foundation: We start with the Bitcoin Power Law, our long-term "strategic map" for the entire crypto market. It tells us if Bitcoin is fundamentally over or undervalued.
- The Golden Signal (for BTC): We then overlay the Bitcoin PAI, our "tactical GPS" for price flow. When the Power Law and the PAI give the same signal (e.g., undervalued + strong downward flow), we have the highest possible conviction.
- The Altcoin Problem: The Power Law is less reliable for younger, more volatile assets like Kaspa.
- The Purpose-Built Solution: We use the Kaspa PAI, a custom-calibrated tool, to get a much more accurate and timely signal for assets where the Power Law falls short.
A Two-Tiered Approach: The Power Law & PAI Framework
To navigate the crypto markets effectively, a single tool is not enough. We need a complete framework that combines a long-term strategic view with a short-term tactical one. This guide will walk you through our two-tiered methodology, showing you how we use the Power Law and the Power Amplitude Index (PAI) to make data-driven decisions.
Tier 1: Bitcoin as the Market's North Star
Everything in the crypto market ultimately flows from Bitcoin. Its long history and consistent growth make it the perfect candidate for our foundational model: The Power Law.
Step 1: The Strategic Map - The Bitcoin Power Law
The Power Law acts as our strategic map. It models Bitcoin's long-term growth trajectory as a predictable, logarithmic channel. It cuts through the daily noise and tells us one simple thing: is the current price above or below its fundamental long-term trend?
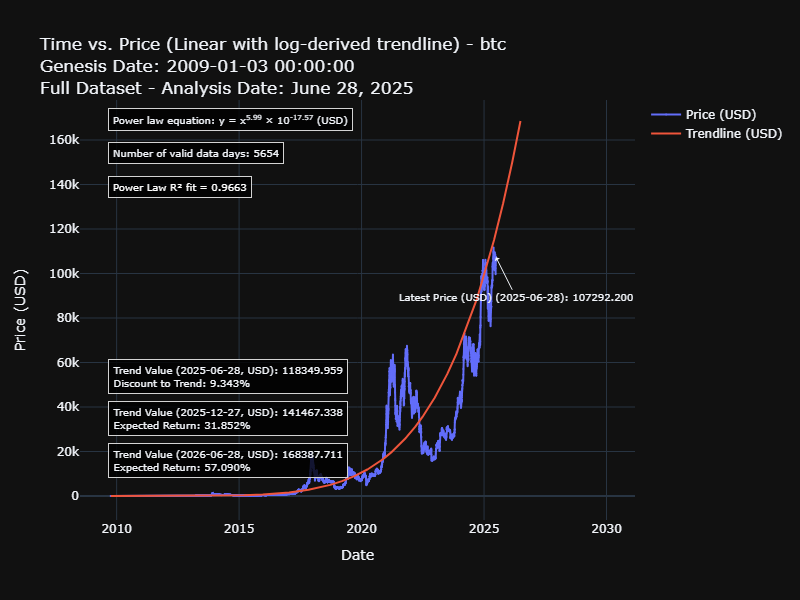
How to read this chart:
- The Red Trendline: This is the statistically-derived "fair value" of Bitcoin over time.
- Price Above Trend: The market is "hot" or overvalued.
- Price Below Trend: The market is "cold" or undervalued, representing a potential accumulation zone.
The annotations on the chart provide precise data on the current trend value and the expected returns if price reverts to this trend over time.
Step 2: The Golden Signal - Convergence with the Bitcoin PAI
Now, we add our proprietary timing tool: the Power Amplitude Index (PAI). The PAI measures price flow on a scale from 0.0 to 1.0. It is our "tactical GPS."
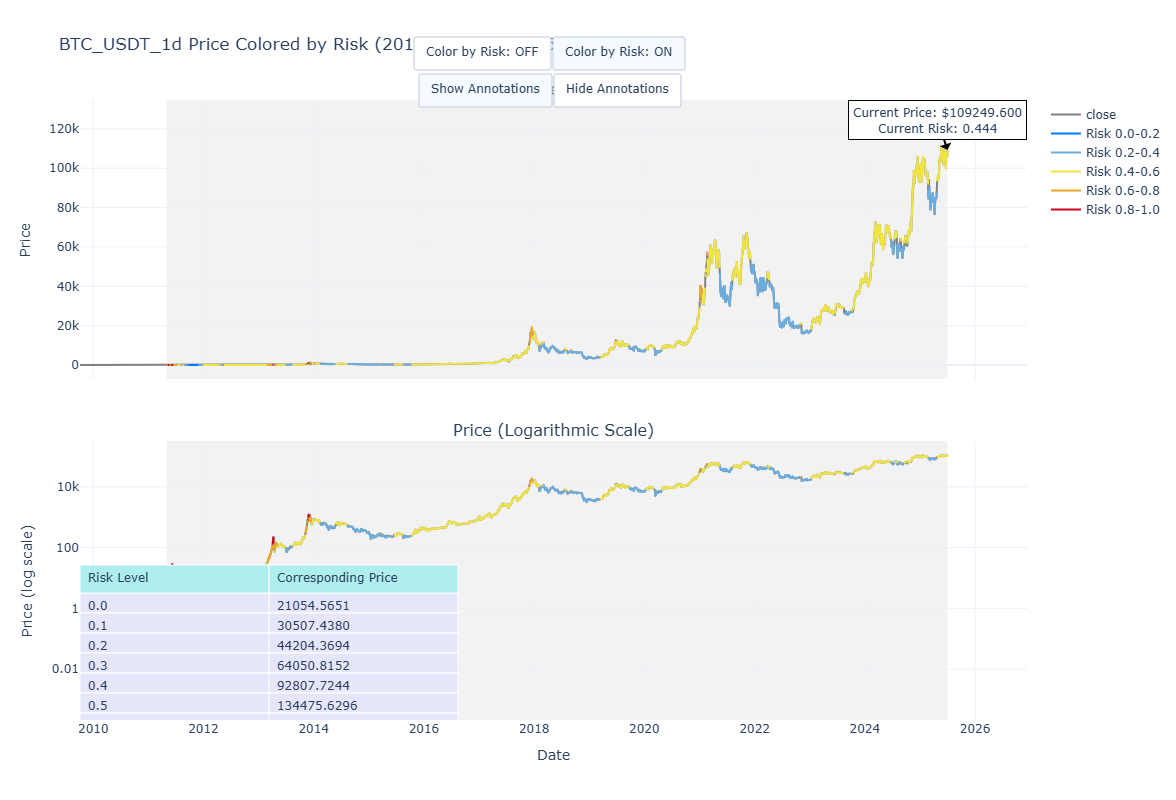
This is where the magic happens. We look for Independent Systems Convergence. When the Power Law (macro value) and the PAI (price flow) tell us the same story, the signal is incredibly powerful.
- Historic Bottoms (e.g., 2020, late 2022): The Power Law chart showed price was deeply undervalued. At the same times, the PAI chart was deep blue (strong downward flow). The models agreed, signaling a generational buying opportunity.
- Historic Tops (e.g., 2017, 2021): The Power Law chart showed price was extremely overvalued. At the same times, the PAI chart was bright red (extreme euphoria). The models agreed, signaling a high-risk time to take profits.
This convergence on Bitcoin gives us our "weather report" for the entire crypto market.
See the Live Chart: For the latest daily data, view the Live Bitcoin PAI Chart.
Tier 2: A Purpose-Built Tool for Altcoins
So, what about younger, more explosive assets? Can we just apply the Power Law?
The Challenge: The Kaspa Power Law
Let's look at the Power Law model applied to Kaspa.
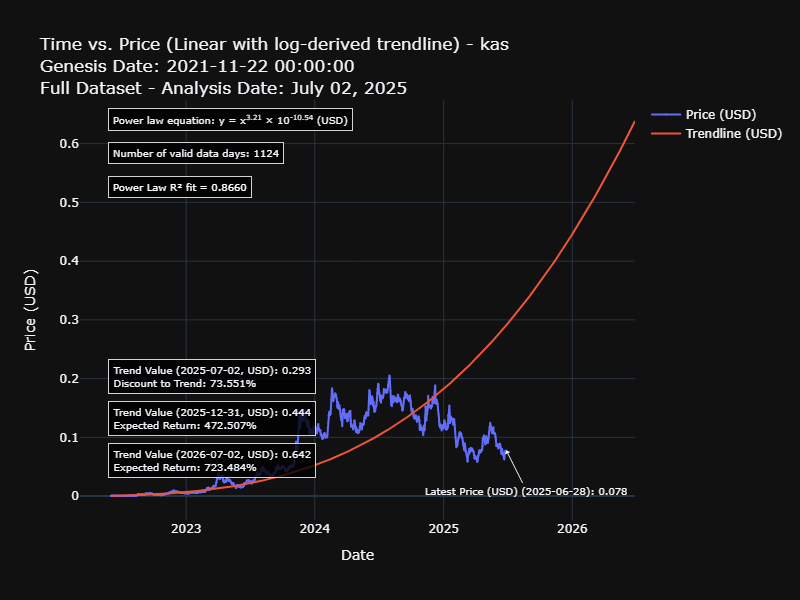
While there is a trend, notice two things:
- The R² fit of 0.8660 is decent, but not as robust as Bitcoin's 0.9663.
- The current price is trading significantly below the trendline, suggesting the model may not be capturing the asset's current dynamics effectively.
For assets like this, relying solely on the Power Law can be misleading. We need a more sensitive, purpose-built tool.
The Solution: The Custom-Calibrated Kaspa PAI
This is precisely why the PAI was created. By focusing on price amplitude and price flow, the PAI can provide a much more timely and relevant signal for volatile assets.
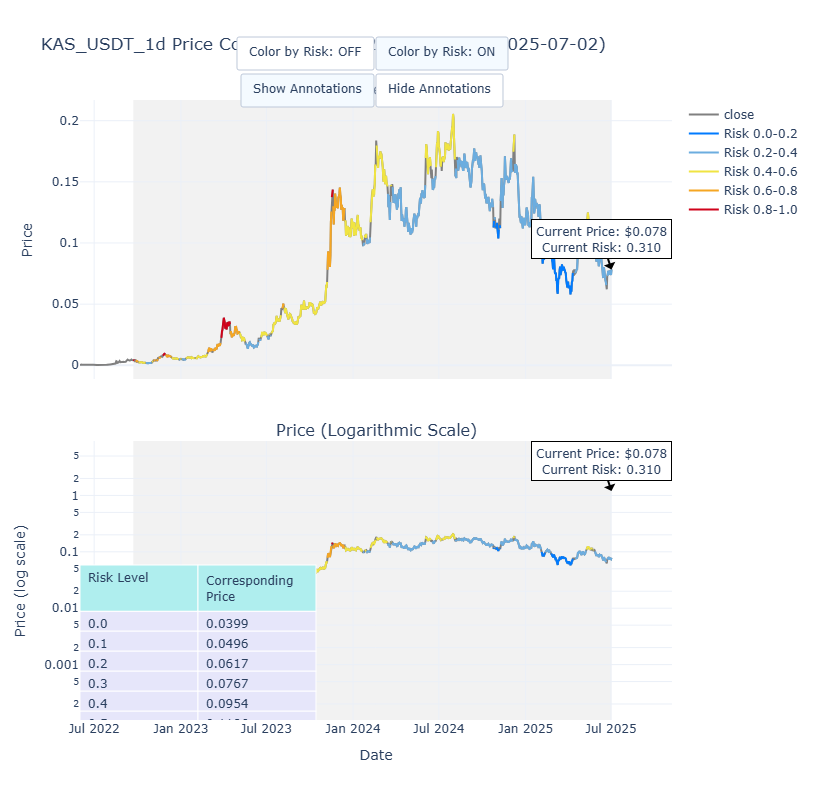
This chart tells a clearer story. It shows the internal price flow cycles of Kaspa, independent of a long-term trend that may not yet be fully established. We can identify moments of moments of strong downward flow (blue) as buying opportunities with far greater precision.
Interpreting the Risk Level Table
For some assets like Kaspa, we include a table that translates the abstract PAI score into a concrete price. If you decide a PAI level of 0.2 is a great entry point, the table might tell you the corresponding price is $0.0617. This makes the model directly actionable.
See the Live Chart: For the latest daily data, view the Live Kaspa PAI Chart.
Our Mission: The Right Tool for the Right Job
The Power Law Investor was founded on the principle of using the right analytical tool for the right job. We use the powerful combination of the Power Law and the PAI to gauge the overall market via Bitcoin. Then, we deploy the custom-calibrated PAI to find tactical opportunities in other assets where the Power Law is less reliable.
This disciplined, multi-layered framework is designed to cut through the noise and help you manage risk and opportunity with data, not emotion. For more on the background and philosophy behind our work, please see the About page.
Next Steps
- Bookmark the Live Charts: Make the Live Bitcoin PAI Chart and Live Kaspa PAI Chart a part of your daily market check-in.
- Subscribe to the Newsletter: To receive periodic updates, analysis on new assets, and deeper insights into our models, sign up below.
About the Analyst
The analytical framework described in this guide was developed by Dr. Rahber Thariani. With a PhD in Bioengineering and professional experience at data-intensive firms like McKinsey and Amazon, his career has centered on one challenge: extracting a clear signal from complex, noisy systems. The Power Law & PAI models are the direct application of this first-principles approach to the world of crypto.
To learn more about his background and the mission behind The Power Law Investor, please visit the full About page.