
Kaspa is Historically Cheap. Why I’m Not Buying Yet.

Date: December 16, 2025
Asset: Kaspa (KAS)
Price: ~$0.042
Kaspa is trading near its historical lows. My proprietary Power Amplitude Index (PAI) is flashing "Blue," a signal that has marked every major bottom in Kaspa's history.
In a normal bull market, this would be an aggressive buy signal.
But we are not in a normal bull market.
We are navigating a potential regime change for Bitcoin and the broader crypto economy. In this environment, "cheap" can get much cheaper. Buying blindly based on value indicators alone is how investors get trapped in a bear market bleed.
Today, I’m breaking down why I am ignoring the "Value" signal for now and switching to a "Momentum" strategy to protect capital.
1. The Value Trap: What the PAI Says
First, let’s look at the data. The chart below shows Kaspa’s price colored by my PAI model.
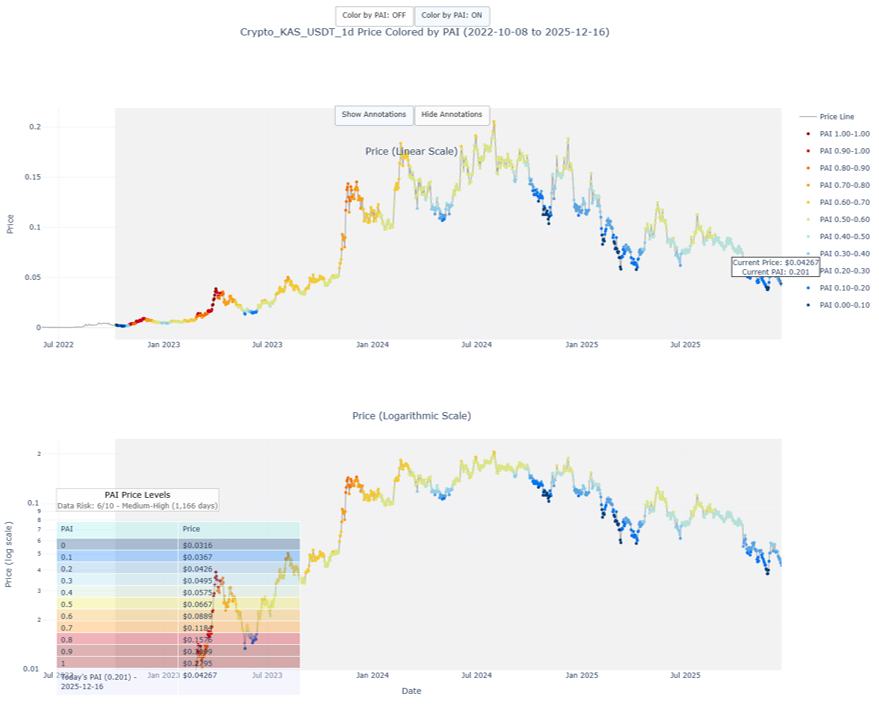
- Current PAI: 0.201
- The Signal: The PAI is deep in the blue zone. Historically, buying when the PAI is around 0.20 has been a winning trade.
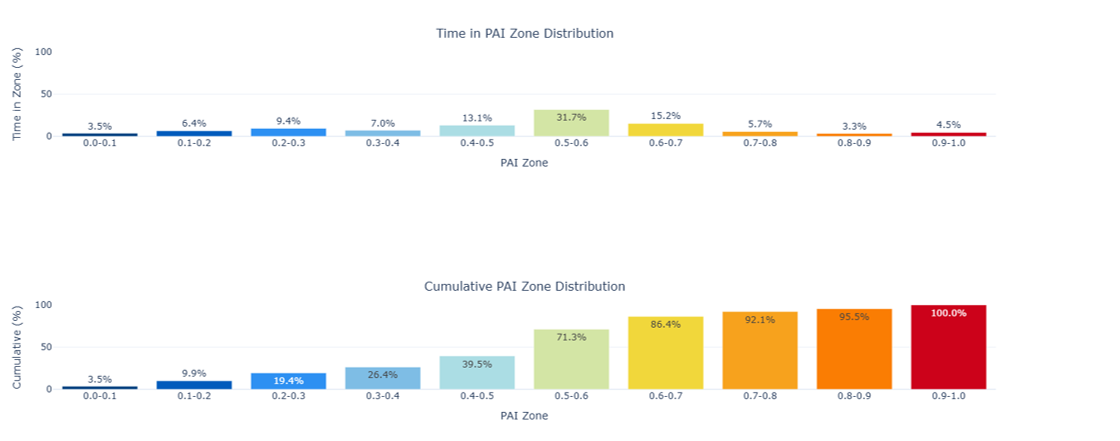
- The Distribution: As you can see in the "Cumulative PAI Zone Distribution" chart, Kaspa has spent roughly 90% of its history priced higher than this relative level.
Mathematically, Kaspa is oversold. So, why not buy?
2. The Blind Spot: Data Risk
The problem is Regime Risk.
As noted in the chart header, the "Data Risk" for Kaspa is Medium-High. Why? Because Kaspa is a young asset. It has approximately 1,166 days of price history. Crucially, it has never experienced a full, prolonged crypto winter where Bitcoin enters a multi-year bear market.
My PAI model "learns" from history. It knows what a dip looks like in a bull market. It does not fully know what a crash looks like in a true bear market.
If Bitcoin continues to show weakness below its 350-day moving average, Kaspa will likely act as a high-beta derivative, dropping further than historical models predict. The PAI floor is dynamic; if prices crash, the "Zero" level will adjust downwards.
3. The Solution: Value vs. Momentum
So, how do we play this? We have a conflict:
- Value Model (PAI): Says "Buy."
- Macro Reality: Says "Wait."
The solution is to switch from a Value Strategy (catching the falling knife because it's cheap) to a Momentum Strategy (buying only when strength is confirmed).
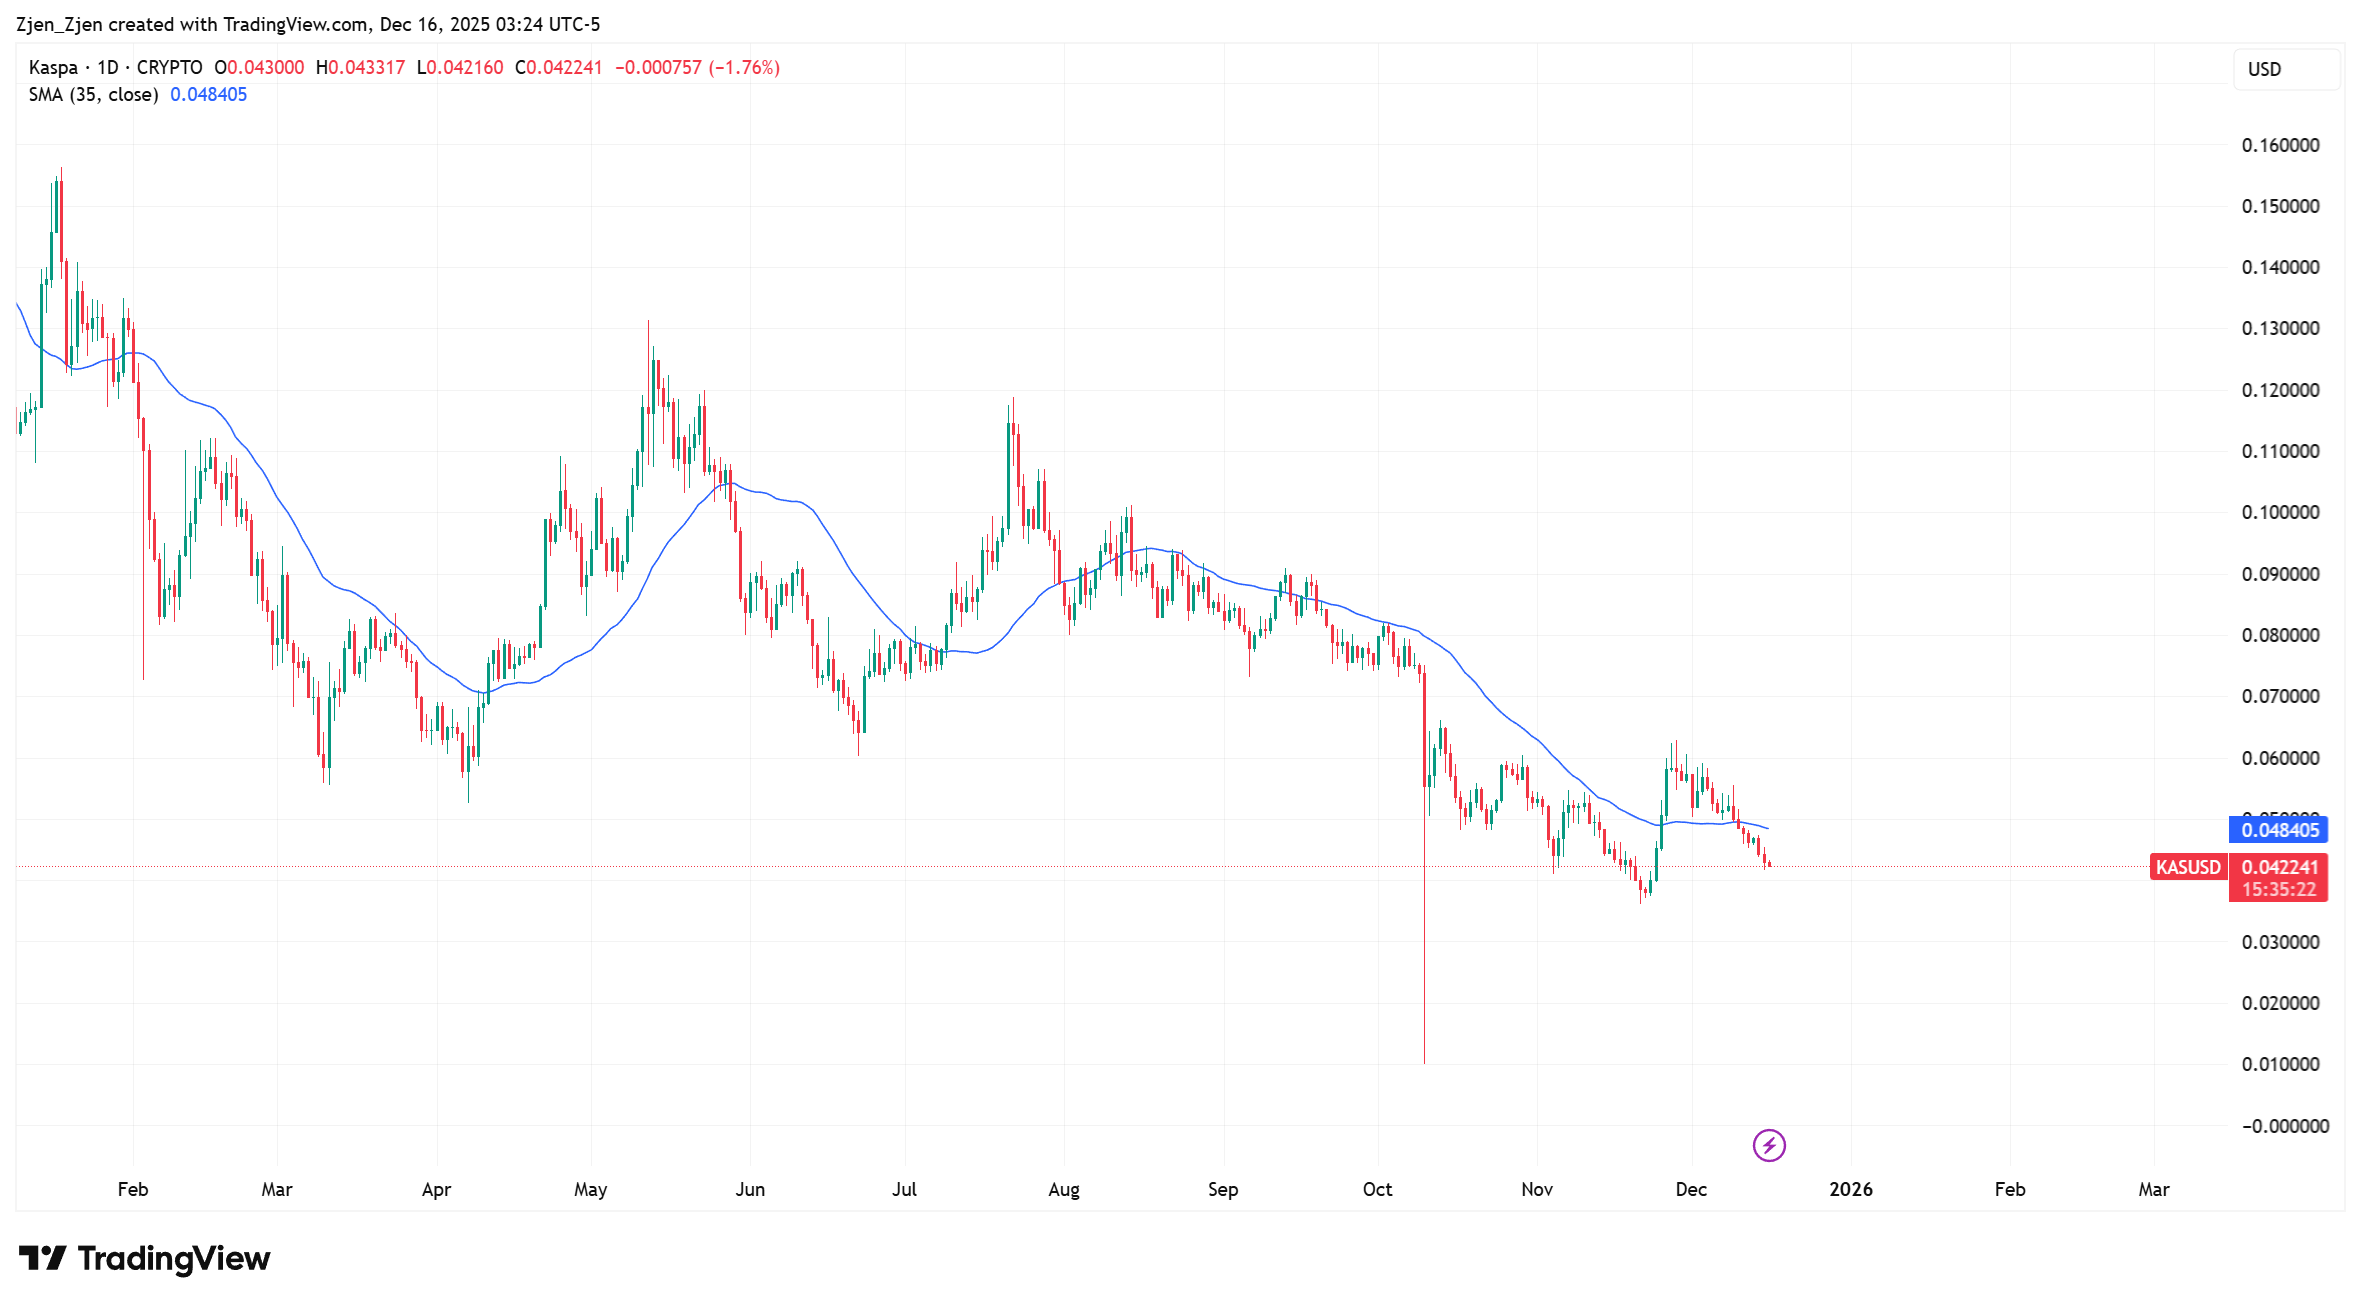
I am using a simple, effective filter: The 35-Day Moving Average (SMA).
The Strategy:
- If Price < 35-Day SMA: I sit on my hands. I protect capital. I assume the trend is down.
- If Price > 35-Day SMA: I buy. I assume the trend has reversed.
This strategy recently saved us from losses. When Kaspa rallied to ~6.3 cents, the Momentum strategy triggered a buy. When it failed and dropped back below ~4.9 cents, the strategy triggered a sell/exit. The result? Flat. No profit, but no massive loss as price continued to slide to 4.2 cents.
In a bear market, breaking even is a win.
4. The "True" Floor: Exploring the Downside
If I were to catch a falling knife, where is the absolute floor?
Looking at the PAI Predictions table in the chart above:
- The model calculates the PAI 0.00 (Absolute Bottom) price is currently $0.0316.
- This represents another ~25% drop from current levels.
While $0.0316 would be a tempting "Value" buy, the safest play remains the Momentum strategy. I am happy to miss the first 10-20% of the move off the bottom in exchange for the certainty that the trend has actually changed.
The Bottom Line
I believe in Kaspa's tech. But I believe in risk management more.
Right now, I am waiting for one of two things:
- Extreme Value: A drop to the ~$0.032 range (PAI 0.00).
- Confirmed Momentum: A daily close above the 35-Day SMA (currently ~$0.049).
Until then, I am watching, waiting, and preserving capital.