
Is Hyperliquid (HYPE) the Next Generational Trade? A Quantitative Deep Dive

Today, we are taking a strictly quantitative look at a relatively new crypto asset: Hyperliquid (HYPE). Currently trading around $30.50, HYPE is the native token of a high-performance Layer-1 blockchain and decentralized exchange (DEX) that burns a percentage of its collected fees daily.
While narrative and hype (pun intended) drive most retail trading, we are going to strip away the emotion. Let’s evaluate this asset through three rigorous lenses: its financial metrics as a business, its historical value probability, and its current momentum structure.
1. The Financial Valuation: Treating HYPE Like a Business
Before looking at any charts, we have to ask: what are we actually buying? Because Hyperliquid operates as an exchange, we can value it similarly to traditional equities.
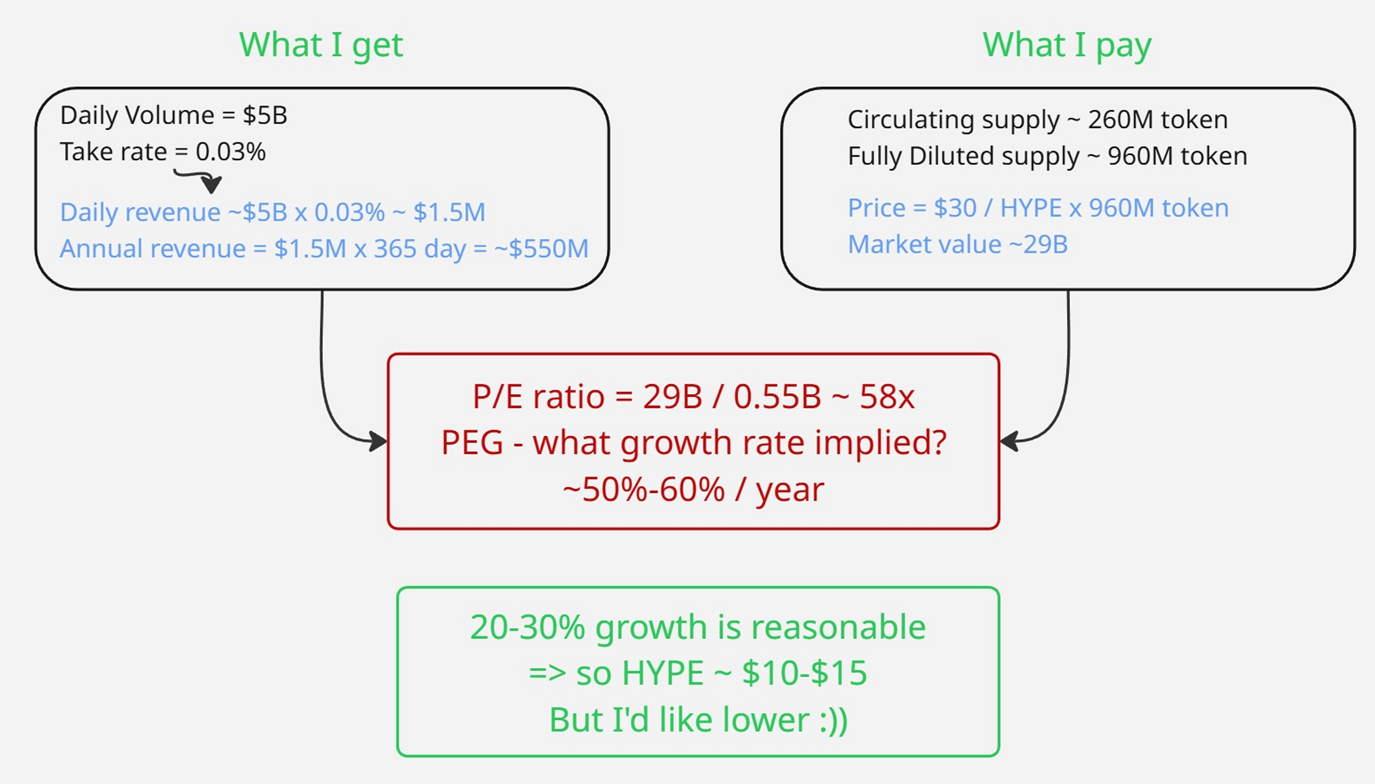
Here is the back-of-the-envelope math using recent averages:
- Daily Volume: ~$5 Billion.
- Take Rate: 0.03%, yielding roughly $1.5 million in daily revenue, converted to HYPE and burned.
- Annualized Revenue: ~$550 million equivalent.
This is a massive cash flow. However, we must price this against the Fully Diluted Value (FDV)—which accounts for all 960 million total tokens, not just the 260 million circulating today—giving us a market value of roughly $29 billion at the current $30 price.
This translates to a Price-to-Earnings (P/E) ratio of approximately 58x. Using a PEG ratio of 1, the current valuation implies an expected annual growth rate of ~50%. For an investor looking for a more conservative 20% to 30% growth rate, a mathematically sound entry point sits between $10 and $15, and with a margin of safety lower still.
2. The PAI Value Perspective: Mapping the Probabilities
We know the long-term fundamental target. But what is the asset doing right now? This is where we apply the proprietary Power Amplitude Index (PAI).
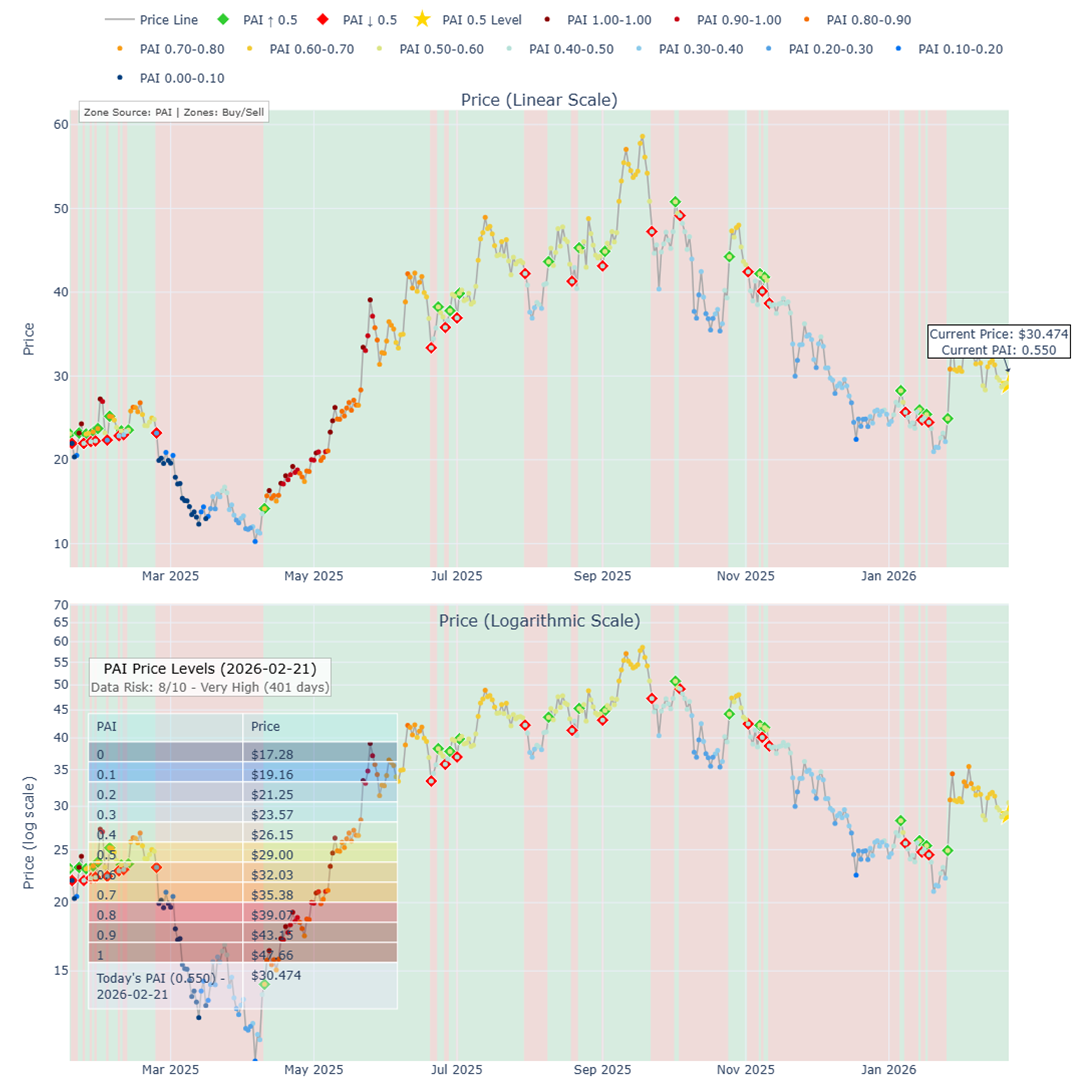
The PAI dynamically assigns a value from 0 (historically oversold/cold) to 1 (historically overbought/hot) utilizing a causal framework and the assets own history. The PAI and calibration is thus unique for a specific asset.
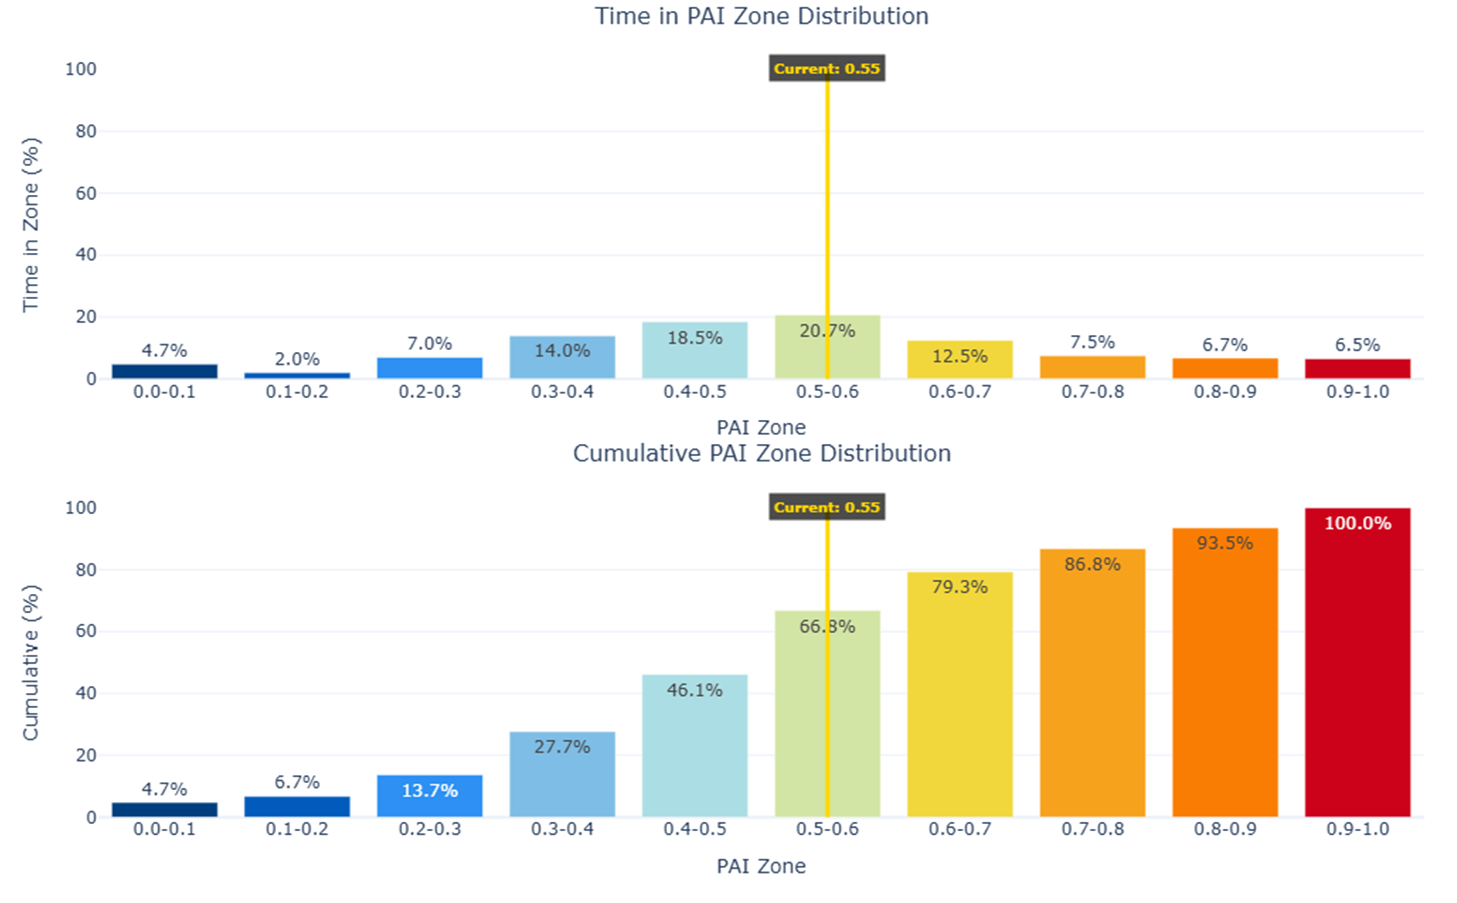
Currently, HYPE's PAI is sitting at 0.55. This tells us that historically, the asset has spent about 60% of its time at lower valuations. If you want to stack the probabilities heavily in your favor, the goal is to buy when the asset enters the bottom ~10% of its historical time distribution.
A PAI of 0.2 or lower for HYPE puts us squarely in this high-probability zone, which currently corresponds to a price range of $17 to $21.
3. The PAI Momentum Strategy: Riding the Trend
Catching a falling knife in crypto is dangerous, even with strict probabilistic models. The alternative is a mechanical momentum strategy: joining the trend when it is confirmed, rather than trying to perfectly time the bottom.
By treating a PAI of 0.5 as the baseline, we establish a strict rule:
- Buy when the price crosses above the 0.5 PAI threshold.
- Sell when the price drops below the 0.5 PAI threshold.
Recently, this mechanical crossover triggered a buy signal at $25, capturing the ride up to $29 and keeping emotion entirely out of the execution.
The Strategy Playbook
So, how do we play this? Here is my current strategic framework:
- Short-Term (Momentum): Wait for a dip below the 0.5 PAI, then buy the subsequent bullish crossover. Currently, this means watching for a drop to the $27 to $28 region, followed by a transition back up through $29.
- Medium-Term (Statistical Value): If the market experiences a heavy drawdown, begin deploying small amounts of capital in the deep-value PAI zone of $17 to $19.
- Long-Term (Generational Value): If macro conditions cause volumes to dry up and the broader market abandons crypto, wait to aggressively accumulate in the mathematically justified fair-value zone of $10 to $15.
This is how we play a game we can win—with structured, high-probability, positive Expected Value mechanics.