
Decoding Kaspa: My Proprietary Risk Metric for Strategic Buying & Selling

Decoding Kaspa: A Proprietary Risk Metric for Strategic Buying & Selling
If you're investing in cryptocurrency, you face the same two questions every single day: "Is now a good time to buy?" and "Is now a good time to sell?"
For a high-growth asset like Kaspa (KAS), this challenge is amplified. Its price action is volatile, and emotions can easily lead to buying at the top and selling at the bottom. My journey started with a simple Dollar-Cost Averaging (DCA) strategy, believing that timing the market was impossible. But what if we could evolve beyond that? What if we could use data to make our DCA "smarter" and identify historically opportune moments to act?
That's why I developed the Kaspa Risk Metric—a proprietary tool designed to cut through the noise and provide a clear, data-driven framework for navigating the Kaspa market.
What is the Kaspa Risk Metric?
At its core, the Kaspa Risk Metric is a valuation and market sentiment indicator that operates on a simple 0 to 1 scale:
- A reading near 0 signifies maximum historical opportunity. The market is in a state of fear or undervaluation. This is historically the best time to be buying.
- A reading near 1 signifies maximum historical risk. The market is in a state of euphoria or overvaluation. This is historically the best time to be taking profits.
This isn't about day-trading. It's a strategic tool designed to guide larger, risk-adjusted decisions, helping us understand when to lean in and when to exercise caution.
The Science Behind the Signal: Data, Not Drama
This metric isn't based on gut feelings, fleeting social media sentiment, or subjective chart patterns. It is the output of a proprietary, mathematically-derived model designed to analyze market valuation and sentiment.
Instead of trying to predict the future, the model processes Kaspa's entire price history to identify periods where it is statistically overextended or undervalued relative to its own past behavior. This allows it to filter out short-term market noise and reveal the underlying state of market psychology—from extreme fear to extreme greed.
The model's parameters have been meticulously optimized through extensive mathematical testing to provide the most reliable signals. Critically, this is a real-time signal. Its calculations only incorporate historical data up to the present moment, ensuring there is zero hindsight bias.
Visualizing the Risk: The Color-Coded Price Chart
The easiest way to understand the metric's power is to see it visually. I've mapped the risk metric's value directly onto Kaspa's historical price chart, creating a color-coded "weather map" for the market.
- Deep Blue / Blue: Low Risk (Metric near 0) - Buy Zones
- Yellow / Orange: Elevated Risk - Caution / Profit-Taking Zones
- Bright Red: High Risk (Metric near 1) - Sell Zones
As you can see, this transforms a chaotic price chart into an actionable guide.
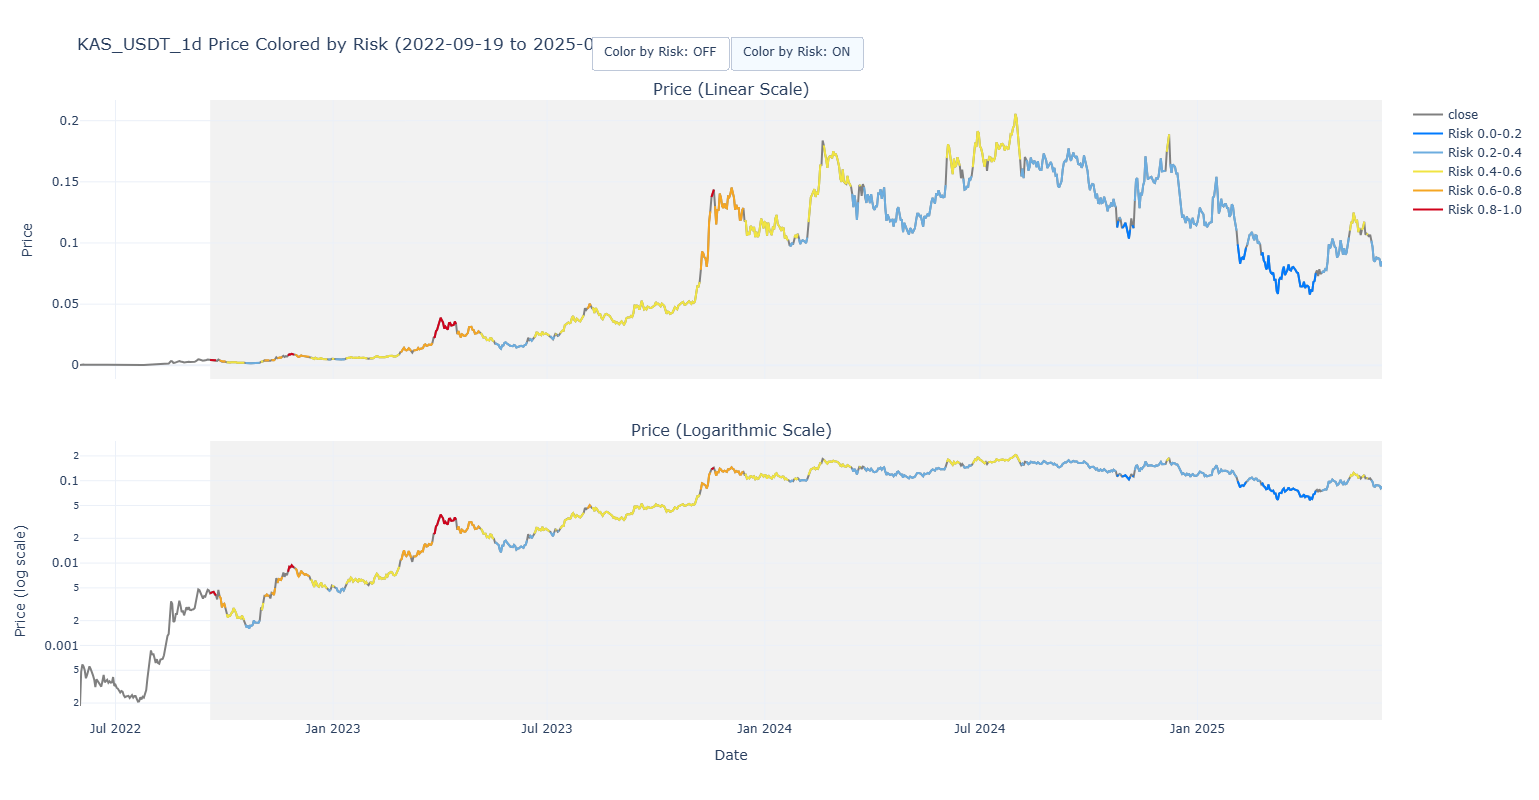
The chart above clearly shows how periods of market fear (blue/green) were incredible buying opportunities, while periods of euphoria (red) preceded major corrections.
From Metric to Action: The Price Target Table
To make this tool even more practical, I’ve translated the abstract 0-1 risk scale into concrete price targets. This table shows you what price Kaspa would need to be at today to correspond with a specific risk level.
Risk Level Pricing
| Risk Level | Price |
|---|---|
| 0 | $0.043 |
| 0.1 | $0.053 |
| 0.2 | $0.066 |
| 0.3 | $0.082 |
| 0.4 | $0.102 |
| 0.5 | $0.127 |
| 0.6 | $0.157 |
| 0.7 | $0.196 |
| 0.8 | $0.243 |
| 0.9 | $0.303 |
| 1 | $0.376 |
This table is your cheat sheet. If you're waiting for the metric to hit the "generational buy" zone of 0.05, you now know the exact price that corresponds to that level.
Today’s Reading: 0.33
As of today, June 6th, 2025, the Kaspa Risk Metric is sitting at 0.33.
What does this mean for our strategy?
Looking at our visuals, a value of 0.33 places us firmly in the light blue "Strategic Accumulation" zone.
This is the essence of "Smart DCA." It's not a signal to go "all-in," nor is it a signal to stop buying completely. It suggests that this is a historically reasonable level to continue accumulating Kaspa. However, it also implies that holding some capital in reserve for a potentially deeper dip (e.g., a move towards the 0.2 or 0.1 risk levels) could be a prudent, data-driven decision.
Conclusion: A Framework for Rational Investing
The Kaspa Risk Metric is designed to be a guiding light, not a crystal ball. It provides a logical framework to manage the two biggest enemies of any investor: fear and greed.
By understanding where we are in a historical context, we can make more rational, less emotional decisions, turning volatility into an opportunity rather than a threat.
For weekly updates on this metric and deeper dives into my analysis for both Kaspa and Bitcoin, make sure you are subscribed to the PowerLaw Investor YouTube Channel.