
Coinbase (COIN) Stock Risk Hits 93% 🚨 My Index is Flashing RED
The crypto market is buzzing with excitement. Bitcoin is flirting with its all-time high, and investor sentiment is overwhelmingly positive. In this environment, major crypto-related stocks like Coinbase ($COIN) are seeing explosive growth.
But as investors, our job is to balance that excitement with a disciplined, data-driven approach. When an asset is soaring, how do we know if we're catching a rocket ship or jumping on a train just before it derails?
To answer this, I've applied my proprietary Power Amplitude Index (PAI) to Coinbase stock. And the results are flashing a significant warning sign.
The Bull Case for Coinbase: The Premier Crypto Stock
First, let's acknowledge why Coinbase is such a compelling investment for many. For those who are hesitant to buy "magic internet money," COIN offers a perfect solution. It's a "picks and shovels" play on the entire crypto ecosystem.
You may not believe in every crypto asset, but if you believe people will continue to trade them, owning a piece of the premier exchange makes sense. Much like Google in search or Meta in social media, the crypto exchange market is likely to be a winner-take-most game. In the US, Coinbase is the undisputed leader with significant advantages:
- US Market Dominance: It's the go-to platform for American retail and institutional clients.
- Regulatory Clarity: As a publicly traded US company, it offers a level of regulatory safety that offshore exchanges can't match.
- Real Fundamentals: This isn't a meme coin. Coinbase has a market cap of over $100 billion and, importantly, it has earnings. It's a real business with a tangible value that can be analyzed.
Given these points, wanting exposure to COIN is a perfectly logical strategy. The question isn't if it's a good company, but when is a good time to invest.
What the Data Says: A PAI Deep Dive on COIN
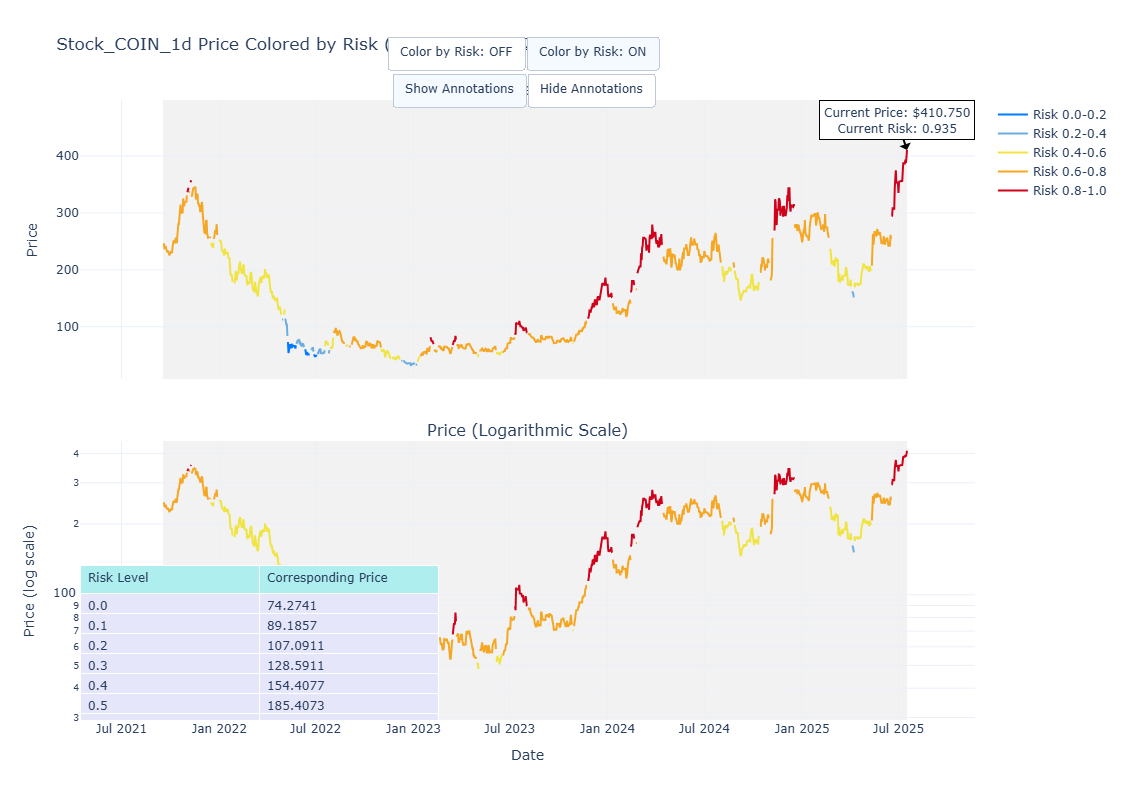
My Power Amplitude Index (PAI) is designed to answer that exact question. It analyzes an asset's price action relative to its own history, assigning a risk value from 0 to 1.
- Blue (0.0 - 0.4): The "cool" zone. Indicates the asset is historically undervalued and presents a strong buying opportunity.
- Yellow/Orange (0.4 - 0.8): The "neutral to warm" zone. Price is heating up.
- Red (0.8 - 1.0): The "hot" zone. Indicates the asset is historically overvalued and poses a high risk for new buyers.
As you can see on the chart, Coinbase's current price of $410 corresponds to a PAI risk of 0.935. It is deep in the red.
This doesn't guarantee the price will crash tomorrow. An asset can stay in the red zone for a while during periods of intense market excitement. However, history provides a clear warning. Look at the previous times COIN entered the red:
- December 2023: The PAI turned red, and the stock subsequently corrected, offering better buying opportunities in the yellow zone.
- April 2024: The PAI turned red again, followed by another significant dip where investors could have entered at a much lower price.
The pattern is clear: a red PAI signal has historically preceded a local top and a subsequent correction, providing more favorable entry points for patient investors.
My Strategy: Why I'm Not Buying More COIN Right Now
Based on this data, my strategy is straightforward:
I am not buying more Coinbase stock at these levels.
While the fear of missing out (FOMO) is strong, the PAI is a tool for discipline. A risk level of 0.935 tells me that the risk/reward ratio is heavily skewed to the downside for new capital. While the price could certainly grind higher, the probability of a significant correction is high.
My personal approach is to wait for the PAI to cool off and re-enter the orange or, ideally, the yellow band. While the PAI cannot predict the future, it provides a robust, data-driven framework for making disciplined decisions.
In conclusion, Coinbase is a cornerstone of the crypto industry and a valuable asset to have on your radar. However, the data suggests that now is a time for patience, not for chasing. We will likely see better, lower-risk opportunities to build a position in the near future.
To get real-time updates on this chart and my analysis of other assets, please sign up for the email list on my website. Don't forget to follow me on X for daily insights and subscribe to the YouTube channel!
This article is for educational purposes only and is not financial advice.