
Bitcoin & Kaspa: The 3:1 Downside Risk No One Is Talking About (State of the Union 2025)

Excerpt: As we close 2025, Bitcoin sits below the Power Law and the 350-day moving average. The data suggests a 75% probability of continued bearish action. Here is my strategy for navigating the next few months.
Date: December 29, 2025
Current Prices: BTC ~$88,000 | KAS ~$0.045
As we close out 2025, the market is sending mixed signals. Bitcoin is hovering just below $88k, and Kaspa is trading around 4.5 cents. If you spend any time on social media, you are likely hearing two extremes: absolute panic or "moon soon" euphoria.
At The Power Law Investor, we ignore the noise and focus on the math. Today, I want to walk you through the data—specifically the Power Law, the Power Amplitude Index (PAI), and the Regime Probabilities—to explain why I believe caution is the most profitable strategy right now.
The Power Law View: Where Should We Be?
First, let's look at the long-term view. The Power Law has historically been the most reliable predictor of Bitcoin's price trajectory, explaining about 95-96% of price variation since Genesis.
Currently, we are sitting below the trend line.
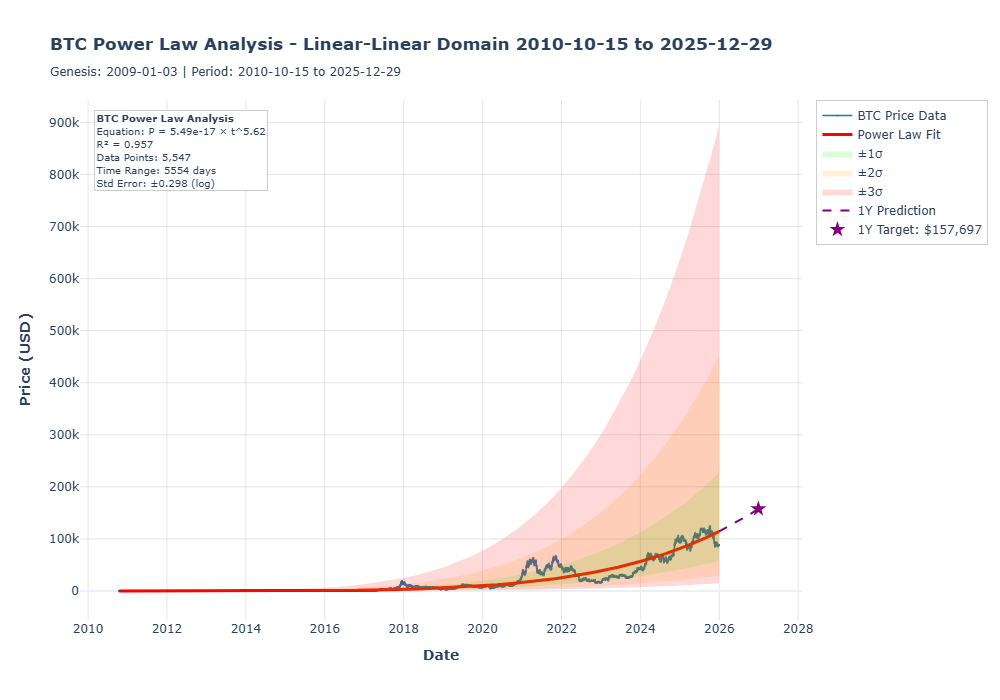
Figure 1: Bitcoin Price vs. Power Law Trend. Note the high R-squared value of 0.95.
If we assume the future mimics the past, the Power Law gives us a "directional vector." The model suggests a 1-year target of approximately $158,000. However, just because the trend points there, doesn't mean we will get there in a straight line.
Currently, we are bouncing below the fair value line. For a true "Alt Season" to kick off, we generally need Bitcoin to break above this Power Law fit, which sits around $115k today. Until we reclaim that level, the "up only" narrative is on pause.
The PAI Perspective: Is This a "Screaming Buy"?
The Power Amplitude Index (PAI) helps us understand cycle positioning. It scales from 0 (historic bottom) to 1 (historic top).
Right now, Bitcoin's PAI is 0.45.
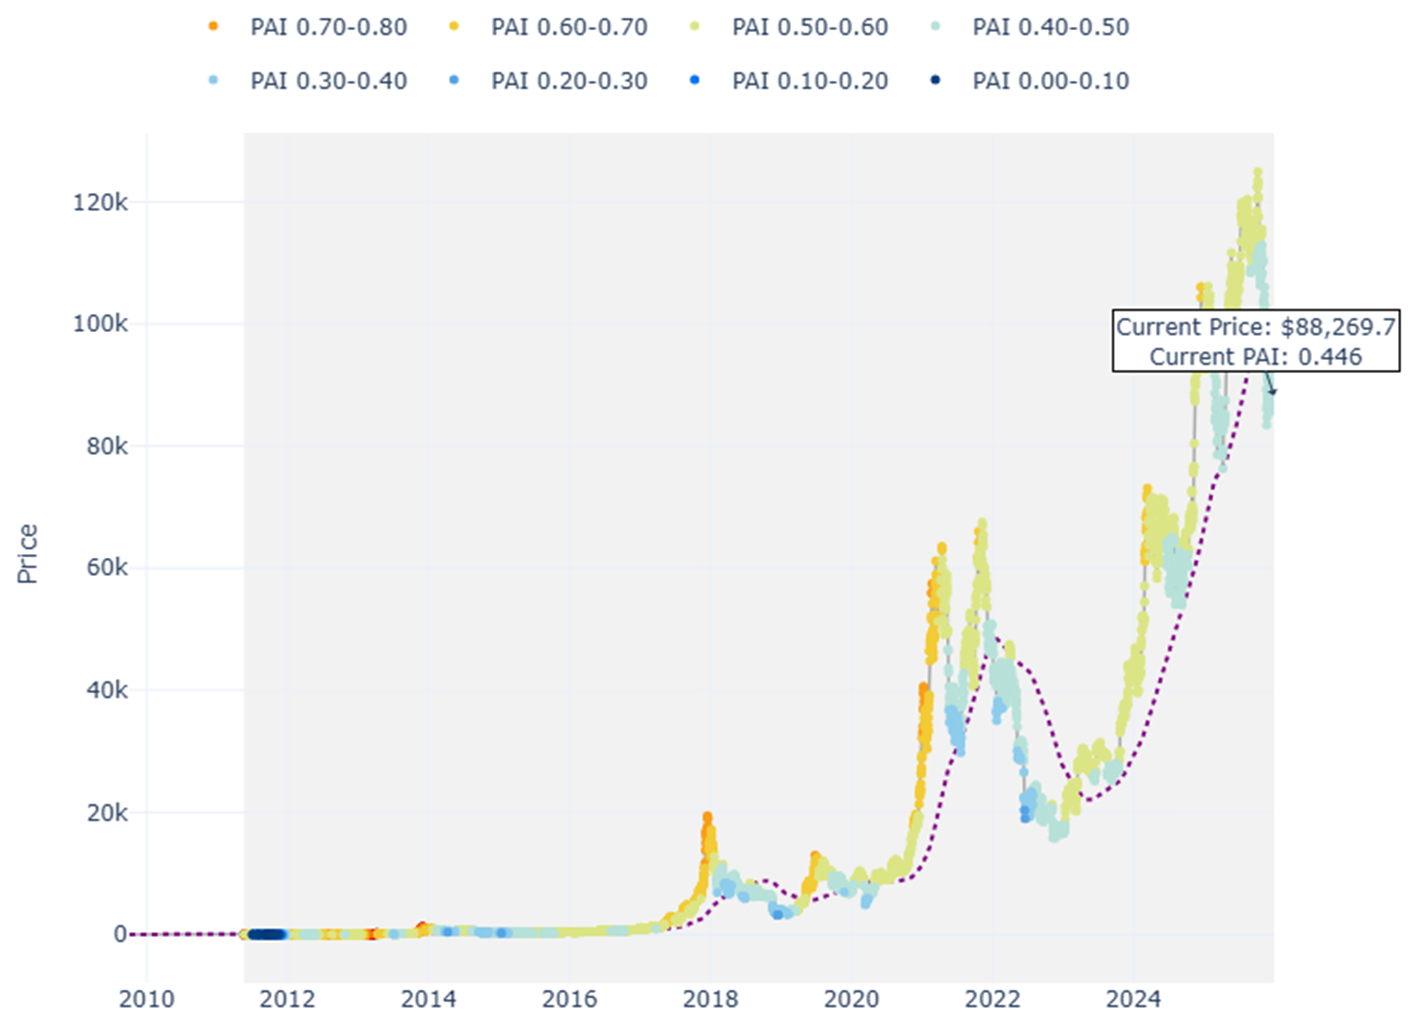
Figure 2: Bitcoin PAI and Price Levels. The current PAI of 0.45 indicates we are in "neutral" territory, not deep value.
A PAI of 0.45 means that historically, the price has been lower than this relative level about 45% of the time.
- Is it a top? No.
- Is it a bottom? No.
True generational buying opportunities (the "screaming buys") happen when the PAI hits the 0.20 – 0.30 range (the dark blue zones in the chart above). We saw this in late 2022 and early 2019. At 0.45, we aren't in the "easy money" zone yet.
The 350-Day Moving Average: The Bear/Bull Filter
This is the most critical chart for the medium term. The 350-day moving average (roughly the 50-week MA) acts as a relentless regime filter.
- Price > 350 SMA: Bull Market Regime.
- Price < 350 SMA: Bear Market Regime.
We are currently below the 350 SMA. Historically (2018, 2022), once we cross below this line, we tend to stay there for a while.
The 3:1 Downside Risk
This is where the math gets sobering. I analyzed the probability of price action based on whether we are above or below this moving average.
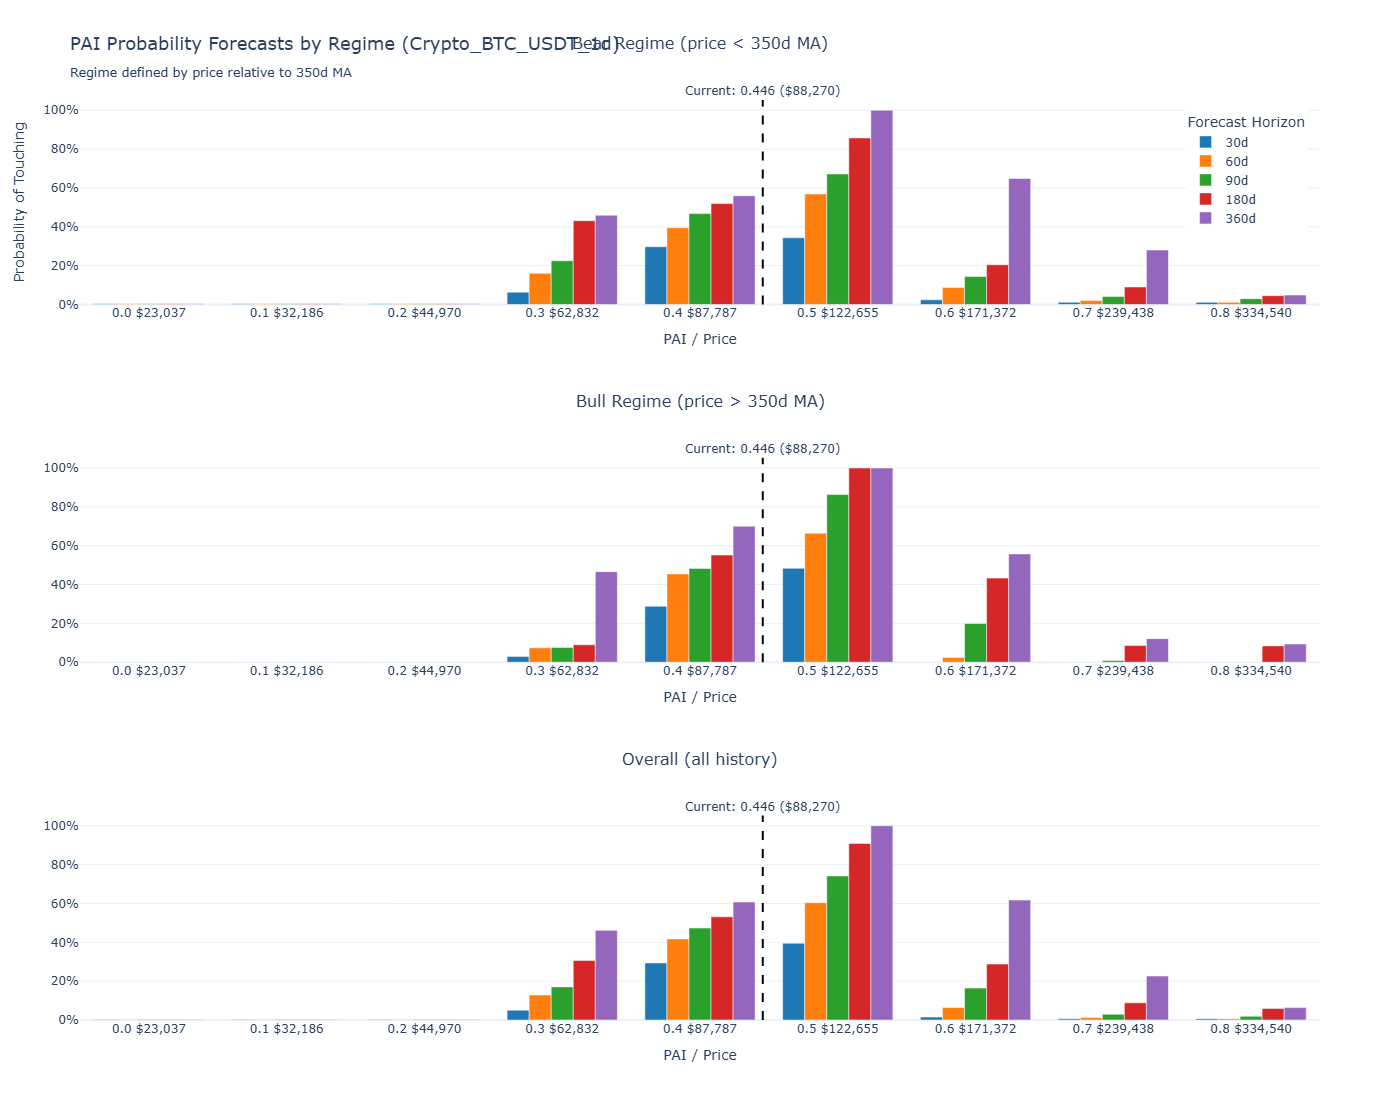
Figure 3: Probability forecasts based on Market Regime. Note the increased downside probability in the Bear Regime (top graph).
When we are in a Bear Regime (Price < 350 SMA), the probability of hitting lower price targets significantly increases compared to the Bull Regime.
Looking at the 90-day horizon:
- Bear Regime Downside Probability: ~22%
- Bull Regime Downside Probability: ~7.6%
That is roughly a 3-to-1 ratio. Statistically speaking, it is three times more likely that we see further downside from here than if we were above the moving average. If I had to put a number on it, the data suggests a 75% chance we remain in a bearish trend in the short term.
My Bitcoin Strategy: Patience Pays
Given the 3:1 downside risk, I am not trying to catch a falling knife. I am playing for risk-adjusted returns. My strategy is simple:
- The Bull Case: I will wait for Bitcoin to reclaim the 350-day moving average (currently around **$102k**). If we cross above that, the probability of a run to the Power Law target ($158k) skyrockets. I will increase exposure then.
- The Bear Case: If we stay below $102k, I will wait for the PAI to drop into the 0.35 range or lower (likely mid-$60k range). That is where the risk/reward becomes asymmetric.
The Kaspa Outlook: Hard Truths
For Kaspa (KAS) holders, the situation mirrors Bitcoin but with higher volatility. KAS is currently trading around 4.5 cents, down significantly from its highs.
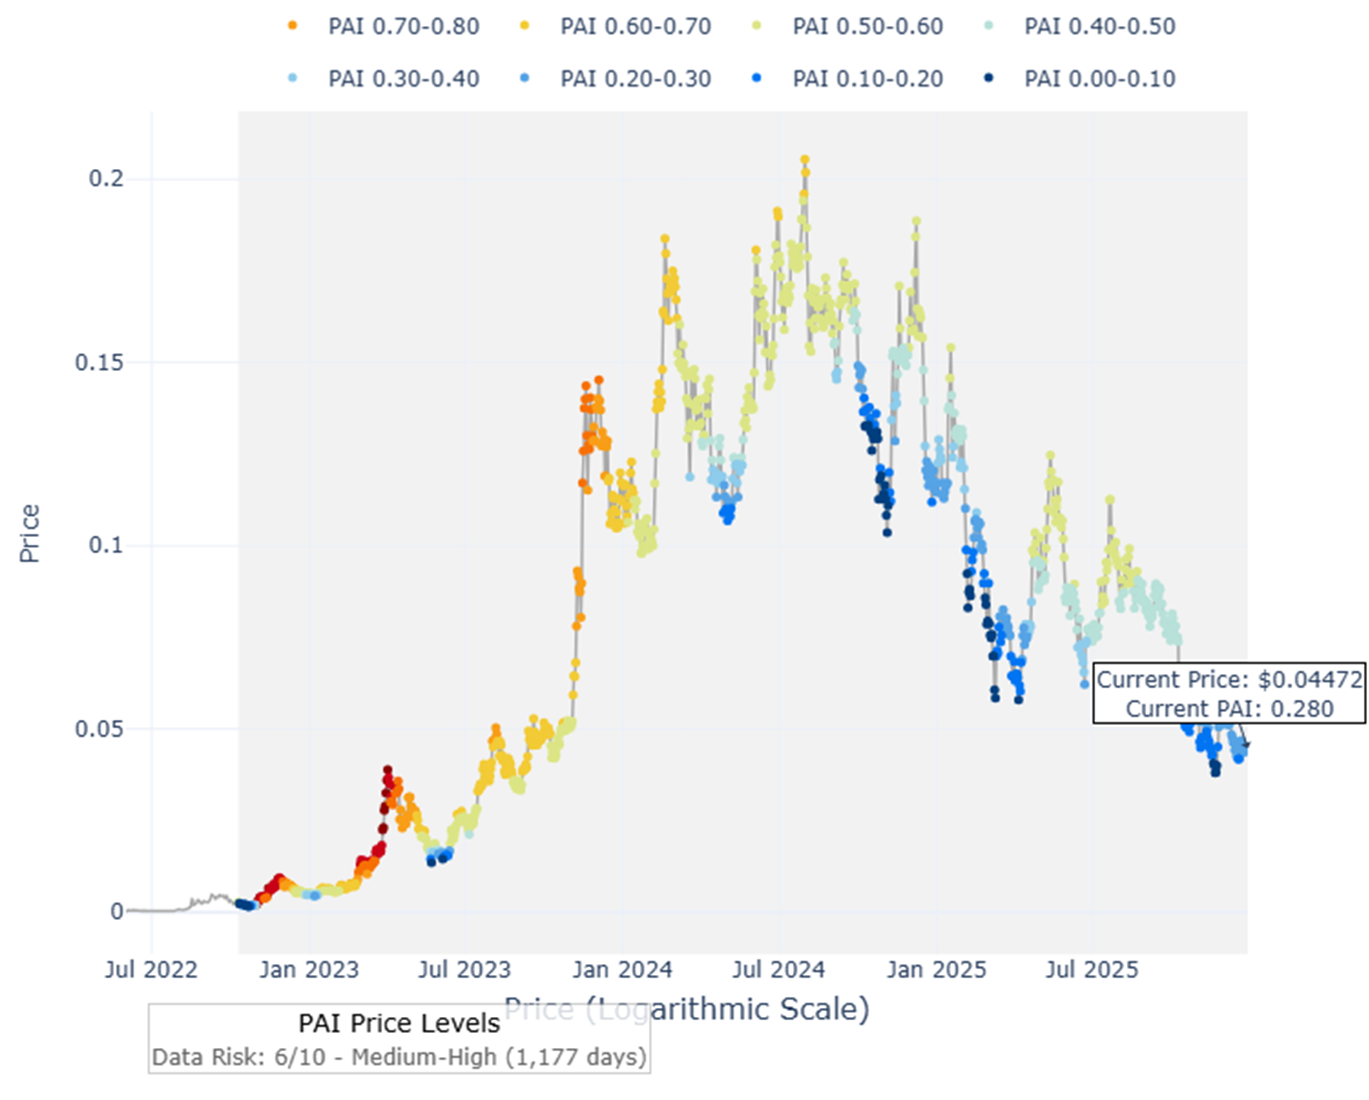
Figure 4: Kaspa PAI Analysis. Current PAI is 0.28.
The PAI for Kaspa is 0.28, which looks like deep value. However, remember that Kaspa's history is short and mostly exists within a broader crypto bull cycle. We haven't seen how deep KAS can go in a prolonged secular bear market.
Strategy for Holders
If Bitcoin drops to the $60k range (as the probabilities suggest is possible), the altcoin market will likely suffer further. Kaspa's PAI suggests a potential floor around 2.9 – 3.0 cents. The caveat here again is that the history for Kaspa is relatively short so we could go considerably lower.
- If you are looking to buy: Putting limit orders around 3 cents is a reasonable play based on the data.
- If you are holding: Ask yourself if you have the stomach for a potential 50% drop from here.
Personally, I prefer the momentum strategy for KAS as well. I am watching the 35-day moving average (currently ~4.8 cents). I would rather buy at 5 cents after momentum is confirmed than buy at 4.5 cents while the knife is still falling.
"I'd rather miss the bottom 10% and capture the safe 80% in the middle, than try to catch the absolute bottom and risk getting wiped out."
Summary
The data is telling us to be cautious. We are below the Power Law, below the 350 DMA, and in a regime where downside is statistically more likely.
Does this mean Bitcoin can't rocket to $100k tomorrow? No. But as investors, we don't bet on "can," we bet on "probable."
My Plan:
- Watch Level: $102k (Bitcoin 350 DMA).
- Buy Level: PAI < 0.35 or confirmed breakout.
- Mindset: Patience. The market will offer a better entry, either at a lower price or a confirmed higher trend.
Disclaimer: This is not financial advice. I am simply sharing the data and my personal interpretation of the Power Law models. Always do your own research.